Evidence-based Planning – Are we serious?
Are we using data effectively to address inequity in our communities?

Do we really know what is going on?
Are we able to make confident projections?
I think not.
This is from a piece I wrote back in 2008 [on a website that is no longer available] and yet I feel the same question is as relevant today as it was almost five years ago. Many have made similar observations over the years.
It is not easy, I grant this, but the challenge is to START and see what happens.
Visualizing complex data [or simple data, for that matter] across time, can help uncover insights and patterns that would be difficult to discover using traditional two dimensional charts. It is also a very powerful way to share insights with non-specialist stakeholders and the wider general community.
The North Central Local Learning and Employment Network Inc. [NCLLEN] has begun an experiment for the benefit of their members, stakeholders and the young people they are charged with serving by making a series of International, State and Local level data available in a more accessible [and I would argue] vastly more strategic manner.
They are taking a leading role in beginning to use data to have an evidence-based discussion with the people that matter most, the community, their stakeholders and government.
The basic premise is that it makes it easier to notice an important trend when data is visualised and allows those that care most about the impact of those trends to compare and contrast what is happening in their OWN communities with communities around them and around the State. This then allows them to respond in a time-frame that is meaningful.
This is the essence of place-based, evidence-led planning. This can be a fundamental reform to traditional methods of public-service delivery.
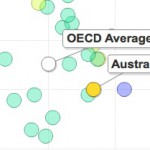
The chart below is just one of a number of tools the NCLLEN have launched to focus planning discussions on the outcomes of young-people in their region.
Their “data-dashboard” can be found at:
Year 12 Attainment
The technology platforms available to us are developing as rapidly as we need them to, meaning that there is plenty of opportunity to use existing data and existing technology, but there is only patchy evidence to suggest that traditional planning and service delivery frameworks used by governments are taking real advantage of these developments.
 I imagine if we really wanted to track student outcomes, or access to affordable housing or any other of the myriad social policy challenges our communities face, we could employ existing data sets and technology in far more efficient, useful and insightful ways than we currently do.
Why don’t we know, in real-time, the students that are disengaged from school ?
Why can’t we see real-time maps of public housing and accommodation availability, rents and conditions?
It still amazes me that we have such lag-times in many key social policy areas when it comes to the political and budgetary processes. Often the time between identifying a budget priority and deploying meaningful services is measured in months, if not years.
Certainly any evaluation of programmes is often measured in years, well beyond the ability to provide meaningful feedback to operational staff, let alone the recipients of the policy, yet Facebook, Google or VISA are able to deploy metrics and measurement tools that are able to segment activity of customers and clients in to minutes/hours/days and use this intelligence to configure marketing and product development that is profoundly personal, when compared to the “mass-market” model.
The developments by Wolfram Alpha back in 2009 are just another example of what is occuring on a global scale. Wolfram Alpha took a first step in an ambitious, long-term project to make all systematic knowledge immediately computable by anyone.
You enter your question or calculation, and Wolfram Alpha uses its built-in algorithms and growing collection of data to compute the answer. Based on a new kind of knowledge-based computing…….
The work by GoogleMaps, the OECD and others are obvious examples of how making sense of immense amounts of data are now easier than ever before.
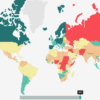
The Global Project on “Measuring the Progress of Societies“- hosted by the OECD and run in collaboration with other international and regional partners seeks to become the world wide reference point for those who wish to measure, and assess the progress of their societies.
We should be able to do something similar on a local scale !
Collecting and disseminationg real-time information, creating new knowledge with new partnerships generates wisdom that can be applied to improve community outcomes.
Inform – Empower – Connect – Advance


