Consider, once again the current political discourse and *major* issues in the news.
Consider the *major* policy announcements of political parties prior to an upcoming Australian Federal Election.
Then take a moment to ponder this.
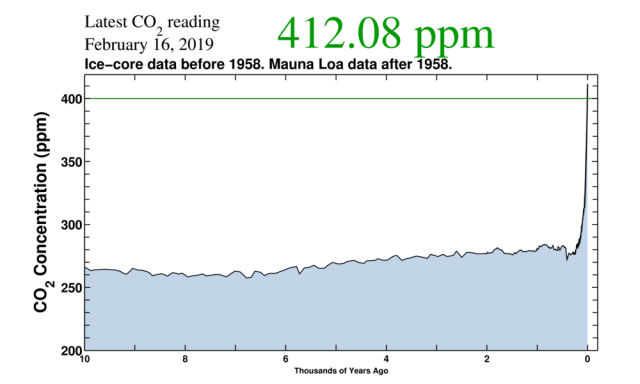
The highest weekly average CO2 ever measured at Mauna Loa: 412.4 ppm, almost 4 ppm above same time last year. February seems on its way to end as highest month too, most probably for the last 2 million years.
2 Million years.
Yeah, let’s talk some more about franking credits…
Current Reading
[Mauna Loa 16th February 2019 | Source: Scripps Inst.]
Consider the state of current general policy response to a warming planet and those that offer ‘opinion’ or ‘identity’ as a generational policy vector. We should take Hitch’s advice…
What can be asserted without proof can be dismissed without proof.
– Christopher Hitchens
In 2015 governments adopted the Paris Agreement to tackle climate change and invited the IPCC to prepare a special report in 2018 to assess the impacts and related pathways of warming of 1.5oC.
This is due on the 8th of October.
The Special Report on 1.5°C assesses three main themes:
What would be required to limit warming to 1.5°C (mitigation pathways)
The impacts of 1.5°C of warming, compared to 2oC and higher
Strengthening the global response to climate change; mitigation and adaptation options
Some food for thought on the IPCC process.
The process of preparing an IPCC report involves both scientists and government representatives.
Ninety-one authors from 40 countries have been involved in the assessment and writing of the Special Report on 1.5 degrees. Chapter teams comprise three Coordinating Lead Authors (CLAs) and a team of Lead Authors, who are responsible for developing the chapter’s content. Review Editors are respon- sible for ensuring the integrity of the review process.
A further 133 Contributing Authors added their expertise to the report.
The report has over 6,000 cited references to the scientific literature.
Forthcoming reports
The IPCC Special Report on 1.5oC is due to be released in October 2018, subject to approval. Two other special reports, Climate Change and Land, and the Ocean and Cryosphere in a Changing Climate, will be published in 2019, as will a refinement to the IPCC’s 2006 Guidelines on National Greenhouse Gas Inventories. The three Working Group contributions to the Sixth Assessment Report will be published in 2021, with a Synthesis Report in 2022.
It will be an interesting exercise to observe global, national and state media.
The Earth has warmed by 1 degree. 2 degrees will bring with it awful consequences. Are we on track for getting the rise under control? Join Robyn Williams and a panel of energy experts at Brisbane’s World Science Festival.
Sam Harris speaks with Joseph Romm about how the climate is changing and how we know that human behavior is the primary cause. They discuss why small changes in temperature matter so much, the threats of sea-level rise and desertification, the best and worst case scenarios, the Paris Climate Agreement, the politics surrounding climate science, and many other topics.
I recently [briefly] participated in a planning session and debate [through my WhaleSongServices consultancy business ] with an ex-colleague and some of his senior/executive staff regarding particular public policy challenges for a Government Department in the near to medium term [5-10 years] and the broader strategic needs of their planning.
We [again briefly] touched on the concept within public debate of “balance” and “both sides” of the story. False equivalence, is in my view, the scourge of public discourse, but it sure sells papers/improves ratings. The rise, of what Barry Jones called many years ago, “managerialism” in public policy, further deadens policy progress in to ‘binary’ decisions that create philosophical and programmatic “trench-warfare”. We find many who wish to find “balance” where there is none, or perhaps are happy with simply being in the trench…
This most certainly does nothing for those in need of sound and strategic public policy [ all of us ].
This exchange made me reflect that if there was only one word a teacher could use in any classroom, if there was only one word I could teach any student or my own children, it would be consilience.
Agreement between the approaches to a topic of different academic subjects, especially science and the humanities.
In other words, multiple, independent, verifiable converging views.
Consider the National Review. The editors describe the National Review as “America’s most widely read and influential magazine and web site for conservative news, commentary, and opinion”
In December 2015, The US National review highlighted [at best] their own flawed methodologies or [at worst] an intentional, untruthful re-adjustment of selective data to support a pre-defined position when they posted on twitter a seemingly straightforward contribution about Climate Change. They said:
The same graph with the Y-axis corrected for scale from Scripps.
[Source: NOAA ]
But what about the Y-Axis?
Yes, anyone that has been through a high-school class of statistics, will probably remember the “Lies, damn lies and statistics” approach that many [most?] teachers seem to take. Right at the top of the “hit-list” is the suspicion drummed into students when someone presents a chart that has a “compressed” Y-Axis. This is, in many circumstances, a valid cause for review, certainly suspicion, if the publisher is unaware that the axis has been compressed.
Sometimes, starting the Y-axis at zero is the BEST way to lie with statistics
Vox.com journalists were so fed-up with the ‘blow-back’ they received whenever they posted a chart with a compressed y-axis, they responded in the way they know best.
Consilience
…but wait, there’s more..
Perhaps the National Review should consider a reconstructed graph going back 2000 years? Proxy measurements can be used to reconstruct the temperature record before the historical period.
From these, proxy temperature reconstructions of the last 2000 years have been performed for the northern hemisphere, and over shorter time scales for the southern hemisphere and tropics [Source: Wikipedia]
Brooke Gladstone [ @OTMBrooke ] and Bob Garfield [ @Bobosphere ] from the ever-valuable and always erudite On-the-media from WNYC in the United States made two excellent contributions to the debate about false equivalence and media reporting in their pieces:
Within the next couple of weeks, a remote part of north-western Tasmania is likely to grab headlines around the world as a major climate change marker is passed.
The aptly named Cape Grim monitoring site jointly run by CSIRO and the Bureau of Meteorology will witness the first baseline reading of 400 parts per million (ppm) of carbon dioxide in the atmosphere, researchers predict.
Hardly news, considering this [2006], this [2009], this [2012], this [2013] this & this [2015], this [2016], just to name a few. Oh! let’s not forget my vote for the understatement of the epoch:
Considering the existential nature of the public policy challenge, it most certainly appears Australian interest [as gauged by Google search trends – yes, hardly scientific] suggests at least one of the trends being graphed is certainly “going south”.
Leadership anyone? Bueller? Bueller?
Google Search
The most recent reading on May 6 was 399.9 ppm, according to readings compiled by the CSIRO team led by Paul Krummel that strip out influences from land, including cities such as Melbourne to the north. (See chart below, with the red line showing the baseline CO2.)
[Source: The Age | CSIRO | BoM ]
Historical Trends
Carbon dioxide concentrations in the air were reasonably stable (typically quoted as 278 ppm) before industrialisation (in the timeframe of human existence).
Since industrialisation (typically measured from the mid-18th century), carbon dioxide concentrations have increased by about 40 per cent, based on measurements from Cape Grim and on air samples collected from Antarctic ice at Law Dome. [ Source: CSIRO ]