

Category: Gov2.0

  • Does Money Win?

    Does Money Win?

    Simply Outstanding Work.

    http://au.politicaldonations.info

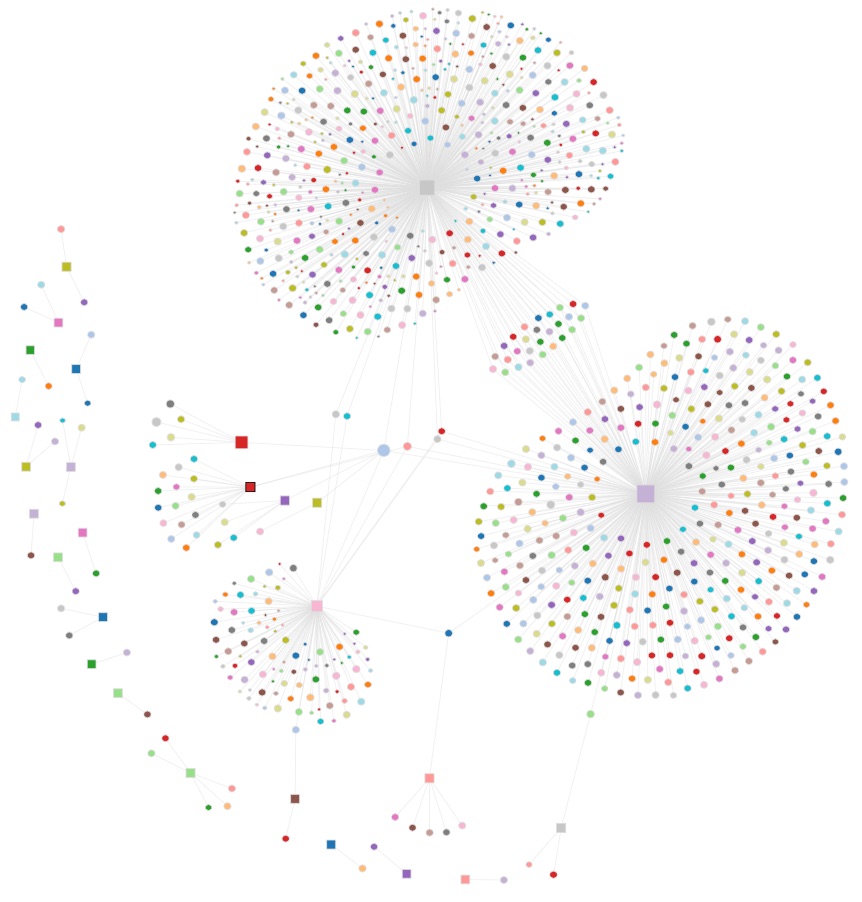
    Australian donations to political parties visualised.

    Look closely at the starting state of the visualisation. Do they look like lungs to you?

    Australian Political Donations
    [Source: http://au.politicaldonations.info ]
    Of course, the phrase “tip-of-the-iceberg” comes to mind.

    The Political Donations visualisation website takes publically available data from the AEC and presents it in a graphical view to make visual analysis of the donations to all political parties in Australia easier and more intuitive.

    The data is presented as a force directed layout showing both links and magnitudes of donations to all major parties. The data can be filtered and detailed information is available by clicking on any node in the layout.

    Links

  • Yeah, Nah.. – Digital Services

    Yeah, Nah.. – Digital Services

    The Victorian Auditor- General has published the interim report examining strategies for delivering services online via digital devices.

    Phase one of this audit specifically reviewed the Victorian Government ICT Governance Framework and the delivery of the Victorian Government Digital Strategy (Digital Strategy).

    ICT-Vict
    [ICT Governance Framework. Source Auditor General]

    Phase two of this audit will be tabled at a later date and will examine service delivery implementation and monitoring and evaluation of service delivery at the department/agency level.

    In a nut-shell, the interim report suggests a “Yeah…Nah”… moment.

    We found that a coordinated and effective whole-of-public-sector approach to digital service delivery has yet to be achieved due to weak strategic leadership and ownership of whole-of-public-sector ICT governance. This issue was further exacerbated by the ineffective coordination and implementation of the Digital Strategy, weak monitoring and accountability mechanisms and ineffective digital engagement to drive digital readiness.

    Without comprehensive and urgent actions to address these governance arrangements and ownership issues, this instability will continue to undermine the establishment of any well-coordinated and integrated approach to delivering public services online effectively and efficiently.

    Of note is the summary of findings

    • Weak strategic leadership and ownership of the whole-of-public sector ICT governance
    • Ineffective coordination of digital strategy
    • and ineffective drive to engage digital readiness.

    Clearly, some work still to do for Victoria.

    Links:

  • Gippsland Youth Commitment Online

    Inspiring Connections.

    GYC
    Gippsland Youth Services Directory

    It is very appropriate in Youth Week 2014 that a group in Gippsland, Victoria, the “Gippsland Youth Commitment“, has developed an online architecture and business model that is designed to get agencies and organisations to work collaboratively by sharing online resources.. for the sole purpose of improving outcomes for young-people.

    Yes, there are many such initiatives.

    What makes this different is that it has been led from the “ground-up” by the Baw Baw Latrobe Local Learning and Employment Network, staff within the DEECD in Gippsland and their partners across many service providers and organisations in Gippsland.

    This is not a trivial thing.

    Gippsland Youth Services DirectoryThe project has developed an online youth services directory that will function on any mobile device, designed particularly for young people looking for services and support within Gippsland.

    This is really just the tip-of-the-iceberg.

    The system also has as a “back-end” management system that is designed for detailed sharing between organisations working to provide youth services in Gippsland. The business model and architecture means it really is “sustainable”, [an often over-used and misrepresented term.]

    This is the key, Combining local leadership and a budget model that understands the financial and technical constraints of rural and regional communities….

    The most recent report by the Victorian Auditor-General on Access to Education for Rural Students highlights the glaring challenges when it comes to deploying Government Policy on a place-based or customised basis. Readers of this blog will know my views on evidence-based-planning.

    This initiative is one of a few that I am aware of that can genuinely address the challenges in the Auditor-General’s report in a positive, meaningful and cost-effective way.

    Caveat/Disclosure

    I have assisted in the development and deployment of this project.

    Links

  • Where does the water go?

    Have you ever dropped a stick in a river and wondered where it might go?

    Streamer
    Streamer – US National Atlas

    For those among us either hydrologically and/or geomorphologically challenged, the new US National Atlas presents “Streamer”, another excellent instalment in “Gov 2.0” initiatives.

    The work of policy-makers, planners, geographers and geographic information experts to visualise the complex inter-relationships between drainage basins, communities and entire nation-wide catchments is another positive step forward for near-real-time evidence based planning so critical to sound, long-term planning.

    This is a new interactive web map that allows you to explore America’s streams by tracing upstream to their source or downstream to where they empty. Users can learn more about stream traces and the places they pass through in brief or detailed reports.

    Murray-Darling?

    Links


  • Evidence-based Planning – Are we serious?

    Are we using data effectively to address inequity in our communities?

    Data
    What's Happening?

    Do we really know what is going on?

    Are we able to make confident projections?

    I think not.

    This is from a piece I wrote back in 2008 [on a website that is no longer available] and yet I feel the same question is as relevant today as it was almost five years ago. Many have made similar observations over the years.

    It is not easy, I grant this, but the challenge is to START and see what happens.

    Visualizing complex data [or simple data, for that matter]  across time, can help uncover insights and patterns that would be difficult to discover using traditional two dimensional charts. It is also a very powerful way to share insights with non-specialist stakeholders and the wider general community.

    The North Central Local Learning and Employment Network Inc. [NCLLEN] has begun an experiment for the benefit of their members, stakeholders and the young people they are charged with serving by making a series of International, State and Local level data available in a more accessible [and I would argue] vastly more strategic manner.

    They are taking a leading role in beginning to use data to have an evidence-based discussion with the people that matter most, the community, their stakeholders and government.

    The basic premise is that it makes it easier to notice an important trend when data is visualised and allows those that care most about the impact of those trends to compare and contrast what is happening in their OWN communities with communities around them and around the State. This then allows them to respond in a time-frame that is meaningful.

    This is the essence of place-based, evidence-led planning. This can be a fundamental reform to traditional methods of public-service delivery.

    The chart below is just one of a number of tools the NCLLEN have launched to focus planning discussions on the outcomes of young-people in their region.

    Their “data-dashboard” can be found at:

    www.ncllen.org.au/data

    Year 12 Attainment

    The technology platforms available to us are developing as rapidly as we need them to, meaning that there is plenty of opportunity to use existing data and existing technology, but there is only patchy evidence to suggest that traditional planning and service delivery frameworks used by governments are taking real advantage of these developments.

    iPhoneI imagine if we really wanted to track student outcomes, or access to affordable housing or any other of the myriad social policy challenges our communities face, we could employ existing data sets and technology in far more efficient, useful and insightful ways than we currently do.

    Why don’t we know, in real-time, the students that are disengaged from school ?

    Why can’t we see real-time maps of public housing and accommodation availability, rents and conditions?

    It still amazes me that we have such lag-times in many key social policy areas when it comes to the political and budgetary processes. Often the time between identifying a budget priority and deploying meaningful services is measured in months, if not years.

    Certainly any evaluation of programmes is often measured in years, well beyond the ability to provide meaningful feedback to operational staff, let alone the recipients of the policy, yet Facebook, Google or VISA are able to deploy metrics and measurement tools that are able to segment activity of customers and clients in to minutes/hours/days and use this intelligence to configure marketing and product development that is profoundly personal, when compared to the “mass-market” model.

    The developments by Wolfram Alpha back in 2009 are just another example of what is occuring on a global scale. Wolfram Alpha took a first step in an ambitious, long-term project to make all systematic knowledge immediately computable by anyone.

    You enter your question or calculation, and Wolfram Alpha uses its built-in algorithms and growing collection of data to compute the answer. Based on a new kind of knowledge-based computing…….

    The work by GoogleMaps, the OECD and others are obvious examples of how making sense of immense amounts of data are now easier than ever before.

    The Global Project on “Measuring the Progress of Societies“- hosted by the OECD and run in collaboration with other international and regional partners seeks to become the world wide reference point for those who wish to measure, and assess the progress of their societies.

    We should be able to do something similar on a local scale !

    Collecting and disseminationg real-time information, creating new knowledge with new partnerships generates wisdom that can be applied to improve community outcomes.

    Inform – Empower – Connect – Advance

  • ABS Spotlight

    ABS Spotlight
    ABS Spotlight

    The Australian Bureau of Statistics has put together another engaging interactive that personalises the 2006 Australian Census data for the user in an interesting and very visual way. [The 2011 Census in Australia was just completed in August ]

    The site is called “Spotlight” and takes some of the data from the last Census [2006] and shows just a few of the interesting things that the Census can tell us about Australia’s people and population.

    It is another great example of visualising complex data in subtly personal ways to help inform and direct policy debates about future planning.

    The ability to “personalise” the interactive by adding, gender, age, postcode and occupation gives the user a context of the personal and local, within the national aggregate. This is a good technique that would be both a wonderful teaching tool as well as a general community resource that encourages evidence-based planning.

    Of course the challenge now becomes providing greatly expanded tools such as this in ways that become routine and accessible for the broader population and electorate.

    Live reporting at regional and local scales, personal updates and real time data input is now needed more than ever. The complexity of decision making within highly complex policy environments requires larger, more timely and more accurate information than ever before. This is a nice start.

    You can find the Australian Bureau of Statistics “Spotlight” website at

    http://spotlight.abs.gov.au/

    Links:

  • Government 2.0

    Local Government first to 2.0.

    In Australia, Government 2.0 is being pursued at a national level. However, in the US, some big cities have moved first. Here is an article about New York City’s initiatives and here is another about Boston’s moves [HT: Darren Challis] Early days yet but very interesting.

    [Core Economics]

  • Public Data Yours or Mine?

    Gov2.0 in the Age.

    Joshua Gans has an opinion piece in The Age today on Government 2.0.

    Taskforce needs to loosen grip on hidden public data

    Joshua Gans, The Age, 6th July 2009 (see also WA Today)

     The Government’s tight control of public information is outdated.

    UNLOCKING the information collection by governments — and deciding what information could be of social value — is the aim behind the new ‘Government 2.0′ taskforce headed by economist Nicholas Gruen.

    The taskforce’s mission results from a key recommendation in the Cutler Review on Innovation — a taskforce that Dr Gruen served on.

    In BusinessDay last August , I highlighted an example with regard to the free availability of public toilet location information — also mentioned in the Cutler review because that information had actually been collected as part of the National Continence Management Strategy and gave Australia perhaps the most comprehensive toilet location map in the world.

    However, that information was provided only in ways the Federal Government chose to and it could not easily be viewed on a mobile device.

    That has improved, but not to the extent of allowing developers to match the information with devices in a truly usable manner.

    Follow the link for more.

  • New Interstate Student Data Transfer System

    School children moving interstate will now be better supported by a nationally agreed system for transferring student information from one school to another. All state and territory education departments and the non-government schools sector have agreed to implement the Interstate Student Data Transfer Note (ISDTN) from January 2006.

    This national system will enhance the ability of the student’s new school to place and support that student in a timely manner and with the assistance of accurate information from the student’s previous school. Documents for the ISDTN are on the MCEETYA website.

    Link: New Interstate Student Data Transfer System.

    Editor’s note: Updated to MCEEDYA Link.