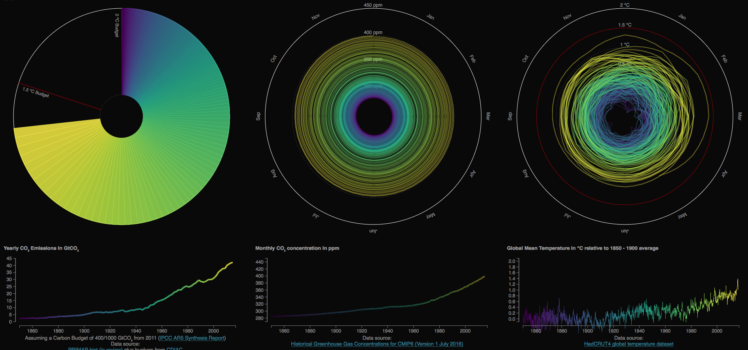
167 global temperature maps - one for every year from 1850 to 2016, in a single chart. These are Robinson projections based on the UK Met Office HadCrut4 Arctic Sea Ice A still image generated from National Snow and Ice Data Center (NSIDC) north pole sea ice extent images. These images [TP Public Data sets] are arranged in a grid pattern with…
Category Archives Environment – Global Warming
I doubt we will get to choose 1.5... An excellent public lecture today in Lab-14 co-hosted by the Australian-German Climate and Energy College, the Climate Institute and the Melbourne Sustainable Society Institute. Thank goodness for the University of Melbourne! In this talk Dr Tabea Lissner (Climate Analytics) and the Potsdam Institute for Climate Impact Research presented regionally differentiated analysis on impact shifts…
Ludovico Einaudi has turned eight million voices into music, Elegy for the Arctic, specially composed to help protect the arctic. Greenpeace says: He performed this piece for the first time — in front of a magnificent surging glacier — the music echoed across the ice, a moment that will remain in our minds forever.The timing of Einaudi’s performance is not…
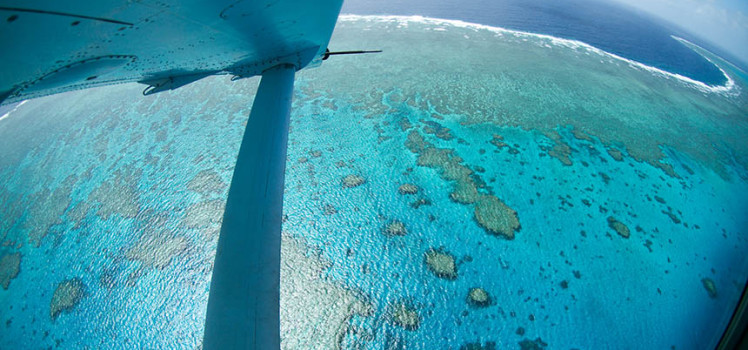
Mathieu Mongin from CSIRO Oceans and Atmosphere and his collaborators published a paper in Nature Communications yesterday, February 23, stating The Great Barrier Reef (GBR) ecosystem, described as one of the seven natural wonders of the world, is under increasing pressure from local and global anthropogenic stressors1. Coral calcification has continued to decline over the last few decades at rates similar to less…

Some thoughts for the new year... The. Hottest. Twelve. Months. EVER... 2015 was Earth’s hottest year by record-wide margin https://t.co/smkEn7VzRz via @NOAA #HottestYear pic.twitter.com/yXrpysDQmQ — Climate Council (@climatecouncil) January 21, 2016 2015 was the hottest year on record globally. Climate change was a major factor in driving the record-breaking heat in 2015 worldwide. The global average temperature for 2015 was…
There’s a lot riding on how Earth spins...
Where were you on November 11th 2015? Bob Henson [ @bhensonweather ] writing in Dr. Jeff Masters' WunderBlog just last week, makes the observation: The daily average concentration of carbon dioxide in the air that day at Hawaii’s Mauna Loa Observatory was 399.68 parts per million. On November 12 it rose to 401.64 ppm, and it’s quite possible that we’ll never see another day in…
Katie Park, the graphics editor at The Washington Post recently published an elegant data visualisation of the impact of the Californian drought on water storage levels. California is in the fourth year of its most severe drought on record, facing low precipitation, dwindling mountain snowpack levels and the hottest temperatures in state history. The water supply in the state’s reservoirs has…
NOAA Coral Reef Watch NOAA Coral Reef Watch (CRW) has developed a new set of experimental 5-km Regional Virtual Stations (211 total). The Regional Virtual Stations represent a change in the way we have looked at Virtual Station data in the past. They have been designed to take advantage of higher resolution data while simultaneously providing comprehensive and collective information on all…