Category Archives Environment – Global Warming
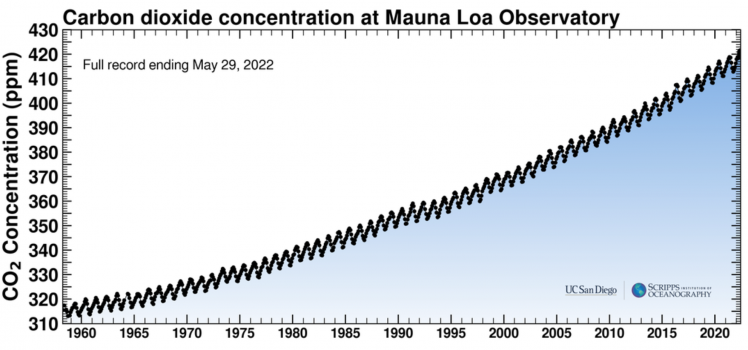
CO2 concentrations at Mauna Loa continue the march... Weather is NOT Climate, most certainly, but this is worthy of note. For the first time temperatures of 40°C have been forecast in the UK and the Met Office has issued the first ever Red warning for exceptional heat.MET Office - United Kingdom UK Temperatures since 1970 The Keeling Curve is a…
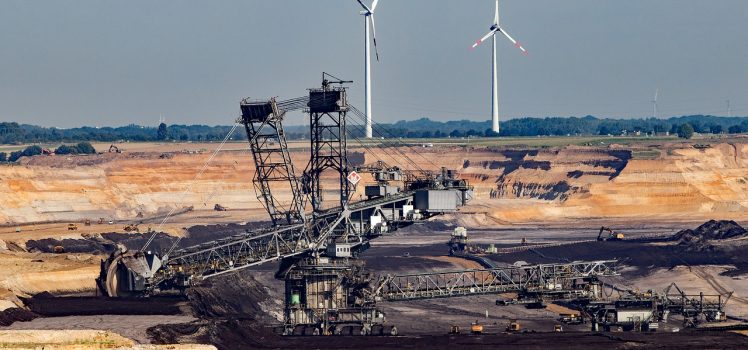
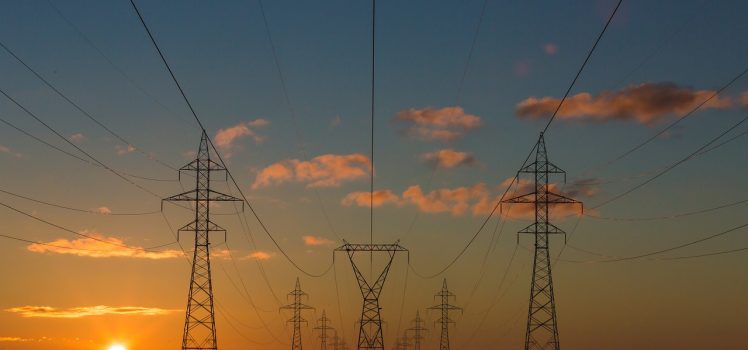
The Group of Seven western industrialised states (G7) has committed to making their electricity systems “predominantly” carbon-free by 2035, but stopped short of setting a concrete date for exiting coal. Following their meeting in Berlin, the G7 environment, climate and energy ministers said only that they would support “an accelerated global unabated coal phase-out”. Analysts said the announcement to decarbonise…
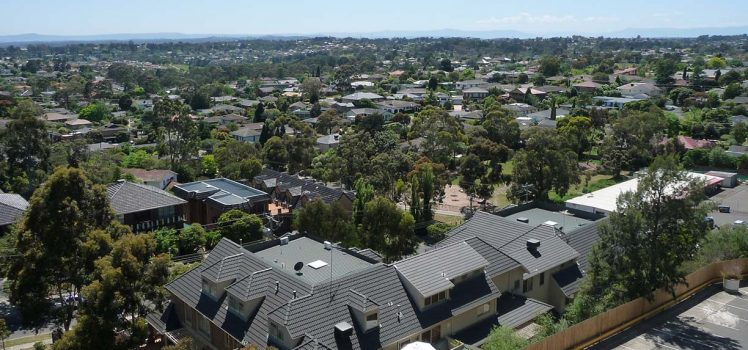
The worlds warming cities. Apologies to the Drifters... When this old world starts getting me downAnd people are just too much for me to faceI climb way up to the top of the stairsAnd all my cares just drift right into spaceOn the roof, it's peaceful as can beAnd there the world below can't bother meLet me tell you nowThe…
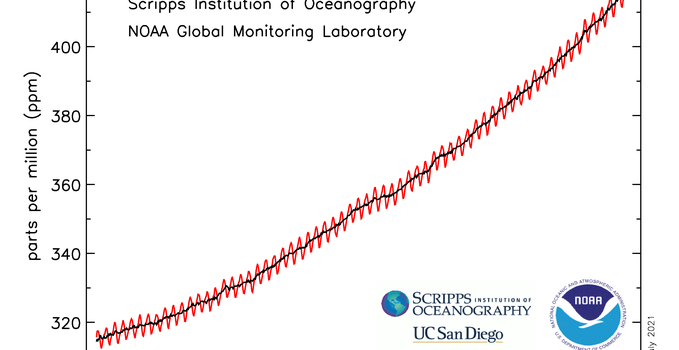
The mean carbon dioxide measured at Mauna Loa Observatory, Hawaii in June 2021 was 418.94ppm. 418.94ppm If I am not mistaken, this is the highest concentration recorded since humans have been on earth? At least it is comforting to know that such existential issues are front-of-mind for our political leaders. You know, "follow-the-science" and all that... Source: NOAA 2021 I…
May 2020 hit a record high, 417 parts per million (ppm) carbon dioxide as measured at the Mauna Loa Observatory, which has continually measured CO2 in the atmosphere since 1958. The reading of 417 ppm is likely the highest it has ever been in the history of humans on Earth. On top of that, it is likely the highest concentration…
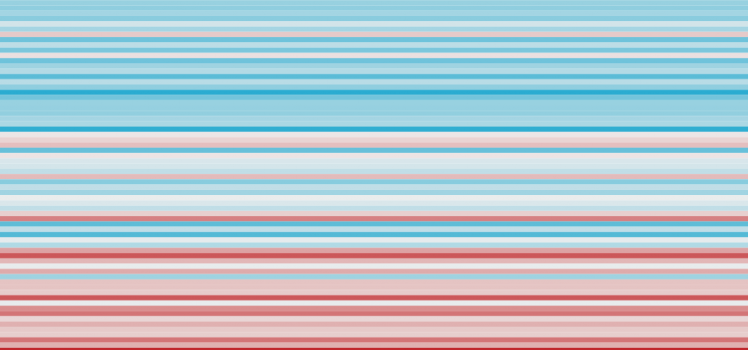
Outstanding work by the ABC team abcnews , storylab, the Monash Climate Change Communication Research Hub and the ARC Centre of Excellence for Climate Extremes to visualise climate change over time and make the global, very personal. From top to bottom, these stripes use Bureau of Meteorology data to show how temperatures have changed in Australia since 1910. The colours indicate how much…
What is the argument against reason and logic? The latest UN Environment Programme (UNEP) emissions gap report suggests that unless the world begins to rapidly reduce greenhouse gas emissions the 1.5C goal of the Paris Agreement “will slip out of reach,” The figure below, adapted from one created by CICERO’s Dr Robbie Andrews, shows emission trajectories to limit warming to…
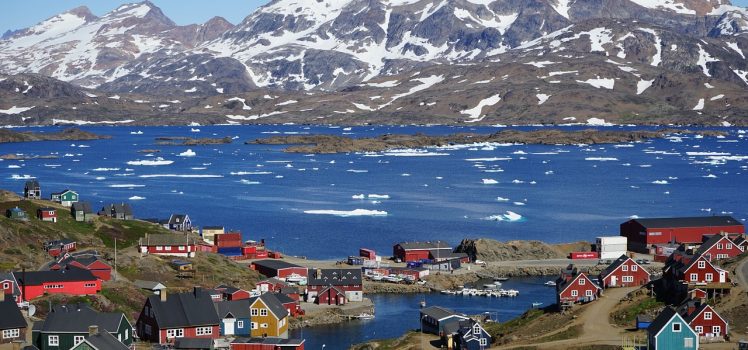
More of Greenland's ice melted in the summers of 2000-2019 than in the ones between 1979-1999. Some data: Links National Snow and Ice Data Center and the obligatory other links... Five from Five 1.5 - Probably Not... IPCC Global Warming of 1.5c 8th of October Oh, yeah, There’s this… Zero Carbon – The Future Called… The Fork in the…