

The term economics comes from the Ancient Greek οἰκονομία (oikonomia, “management of a household, administration”) from οἶκος (oikos, “house”) + νόμος (nomos, “custom” or “law”), hence “rules of the house(hold)”.
A forum at the Australian National University today explored the idea of Australia moving to a universal basic income scheme. What is it and how would it work? @AusTaxProf explains. pic.twitter.com/Q4CUiY0ITe
A basic income has been advocated by some because of concerns about wage inequality and the possible ‘hollowing out’ of the labour force due to technological change.
Important reasons for a BI include to improve adequacy, alleviate work disincentives and poverty traps arising from high effective marginal tax rates and to reverse complexity, conditionality and stigmatisation in social security. But designing and implementing a BI faces many challenges. The fiscal cost of a BI – the tax rate required to finance it – has so far prevented its adoption at an adequate level in any country. The seminar investigated the design and modelling of different options for a categorical BI which could be a first step in the Australian context.
Whilst writing this article, Bitcoin passed the $USD9000 dollar mark and has peaked a little over USD$ 9600…$BTC.X
You may ask yourself “why do bitcoins have value“. My personal view is that any parent that has had to explain to their children why they should not give away their brand new bicycle in exchange for a “golden swap card” has some sense of the global bubble formed around bitcoin… but that is for another time.
[Traders Sentiment – Source: plus500.com]1 Bitcoin currently equals $12, 689.03 Australian Dollars. The price movements look like this.
[ Price of Bitcoin : Source Plus500.com ]Ever since its inception Bitcoin’s trust-minimizing consensus has been enabled by its proof-of-work algorithm. The machines performing the “work” are consuming huge amounts of energy while doing so.
[BitCoin global energy use – Source: powercompare.co.uk/ ]That’s the equivalent of 0.13% of total global electricity consumption. While that may not sound like a lot, it means Bitcoin mining is now using more electricity than 159 individual countries (as you can see from the map above). More than Ireland or Nigeria [ and almost all of Africa].
Bitcoin miners use the equivalent of approximately 13% of Australia’s total energy use.
Our island neighbour, Timor-Leste sees bitcoin miners use the equivalent of 23184% MORE electricity than their entire island nation.
[Variation in power use | Source: https://powercompare.co.uk/bitcoin/ ]If Bitcoin miners were a country they’d rank 61st in the world in terms of electricity consumption.
In 2015 we knew that with about 110,000 transactions per day works out to 1.57 US households daily usage of electricity per Bitcoin transaction. Consider that every time you buy something in Bitcoin, you could be using as much electricity as 1.57 American families do in 24 hours.
Exponentiation anyone?
Energy policy?
The trends.
In the past month alone, Bitcoin mining electricity consumption is estimated to have increased by 29.98%
If it keeps increasing at this rate, Bitcoin mining will consume all the world’s electricity by February 2020.
Estimated annualised global mining revenues: $7.2 billion USD (£5.4 billion)
Estimated global mining costs: $1.5 billion USD (£1.1 billion)
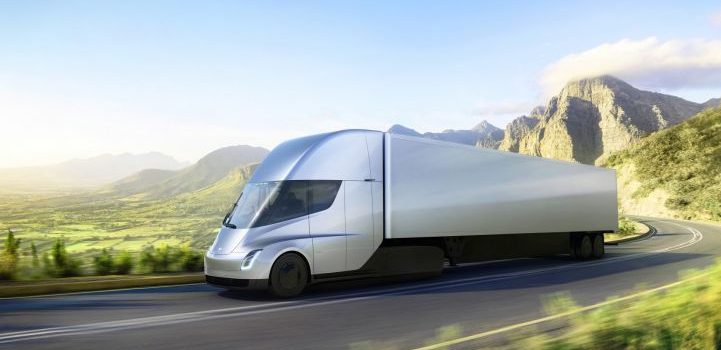
The announcement by Elon Musk of his proposed electric semi-truck and new roadster almost broke the internet last week.
Perhaps missed in the hype, cheering and very loud music accompanying a very, very, very fast red car, was a small, but potentially profound announcement about the truck “mega-chargers” and the flat-priced provision for charging these trucks.
Innovations in this sector are highly focussed on the elephant in the room. Running costs. The famous UPS “don’t turn left” innovation saves millions, but Musk’s numbers look like he might genuinely change the face of the industry and address some of the drivers of climate change at the same time.
This is potentially the single biggest disruption in the transport and logistics industry; ridiculously cheaper, fixed cost “fuel”. This truck is a “day-tripper”, with no sleeping/overnight cabin.
Musk suggests a flat-price of electricity at the mega-chargers of 7 cents Kwh. Powered by their own solar photovoltaics.
He detailed that at 7 cents per kilowatt-hour, assuming a diesel fuel price of US$2.50 per gallon, coupled with insurance and maintenance costs, a Tesla Semi driven at 60 miles per hour with an full load on a 100-mile route would cost about $1.26 a mile to operate, compared to $1.51 per mile for a diesel truck.
Design
The truck’s drag coefficient is 0.36, which is actually less than the 0.38 coefficient of the Bugatti Chiron, one of the world’s fastest sports car. A diesel truck, by comparison, has a coefficient of between 0.65 and 0.7. [Think of a brick versus a bullet]
Platooning [ Investment multiplier]
As mentioned in presentations and on my WhaleSongServices blog, “platooning” will [and is] already changing the face of transport planning. Musk said that Tesla Semis will be capable of platooning, and in that configuration a diesel truck will be twice as expensive. The ability to digitally link trucks together for greater efficiency makes it
“not just economic suicide to use one diesel truck; it’s economic suicide for rail”
Kiata Wind Farm is a wind energy project located 50km north west of Horsham, Victoria. Windlab, an Australian owned company, is developing the project from its Canberra headquarters. Kiata Wind Farm is a 30 MW wind farm. When operational the project will provide enough clean energy for over 20,000 households.
It [WindLab] was established to commercialise world leading atmospheric modelling and wind energy assessment technology, developed by Australia’s premier scientific research institute, the CSIRO.
Technology companies now account for about 2% of total Global Carbon emissions, that rivals the aviation industry. Let’s not even consider the amount of fresh water they require, that’s another article…
Google’s data centres and the offices for its 60,000 staff will be powered entirely by renewable energy from next year, in what the company has called a “landmark moment”.
Google is already the world’s biggest corporate buyer of renewable electricity, last year buying 44% of its power from wind and solar farms. Now it will be 100%, and an executive said it would not rule out investing in nuclear power in the future, too.
Url Hölzle, Senior Vice President of Technical Infrastructure for google said recently:
I’m thrilled to announce that in 2017 Google will reach 100% renewable energy for our global operations — including both our data centers and offices. This is a huge milestone. We were one of the first corporations to create large-scale, long-term contracts to buy renewable energy directly; we signed our first agreement to purchase all the electricity from a 114-megawatt wind farm in Iowa, in 2010. Today, we are the world’s largest corporate buyer of renewable power, with commitments reaching 2.6 gigawatts (2,600 megawatts) of wind and solar energy. That’s bigger than many large utilities and more than twice as much as the 1.21 gigawatts it took to send Marty McFly back in time.
[Source: Environment Google 2016 ]
He points out a simple business imperative:
The science tells us that tackling climate change is an urgent global priority. We believe the private sector, in partnership with policy leaders, must take bold steps and that we can do so in a way that leads to growth and opportunity. And we have a responsibility to do so — to our users and the environment.
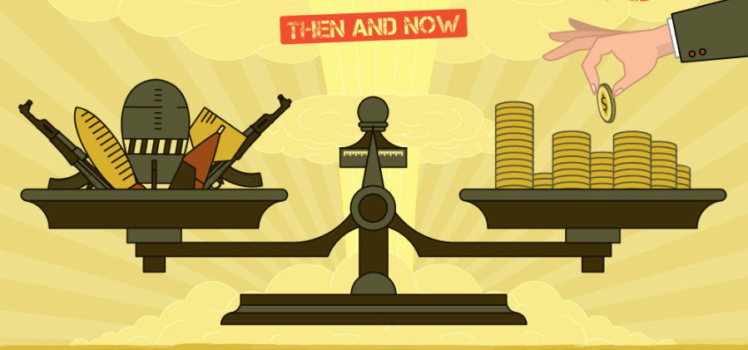
An outstanding comparative analysis of the dollar “cost” of US Wars, “then and now”.
Apologies to [either Dirksen or Rockefeller], but certainly, once we have a trillion here, and a trillion there, “pretty soon, you’re talking real money” !
We know these numbers are staggering. Recently [late 2015], Bank of America Merrill Lynch [ BoAML ] produced analysis showing that:
The US spends more on its defence budget than the next fifteen [15] countries combined
The US Pentagon spends more than all 50 States in the US spend on health, education, welfare and safety combined
The US has 5% of the world’s population but almost 50% of total global military spending
Note: Consider the little country in the bottom right-hand corner! [Australia], punching above our weight as they say! More to come
Global Defence Spending
[Source: BoAML – Transforming World Atlas 2015]
Norwich University has produced this infographic, depicting the comparative size/percentage of military expenditure in wars fought by the United States of America.
Though it lasted fewer than four years, World War II was the most expensive war in United States history. Adjusted for inflation to today’s dollars, the war cost over $4 trillion and in 1945, the war’s last year, defense spending comprised about 40% of GDP. During that time, the government used new methods to raise the required funds and succeeded in accomplishing its goal. While the wars waged in today’s world are significant and costly, they still pale in comparison to the size and financial impact of World War II.
The Global Finance Magazine recently released an article comparing countries by income across the world for 2015, sourcing data from the World Bank. Gross National Income (GNI) per capita is the final income earned by a country’s residents divided by the total population.
Countries are divided into 4 different groups:
Group 1 – Low income: $1,045 or less
Group 2 – Lower middle income: $1,046 to $4,125
Group 3 – Upper middle income: $4,126 to $12,745
Group 4 – High income: $12,746 or more
Based on the data of 204 countries, below is a breakdown of the number of countries that fall within each of the 4 income groups listed above.