167 global temperature maps - one for every year from 1850 to 2016, in a single chart. These are Robinson projections based on the UK Met Office HadCrut4 Arctic Sea Ice A still image generated from National Snow and Ice Data Center (NSIDC) north pole sea ice extent images. These images [TP Public Data sets] are arranged in a grid pattern with…
Tag Archives HadCRUT4
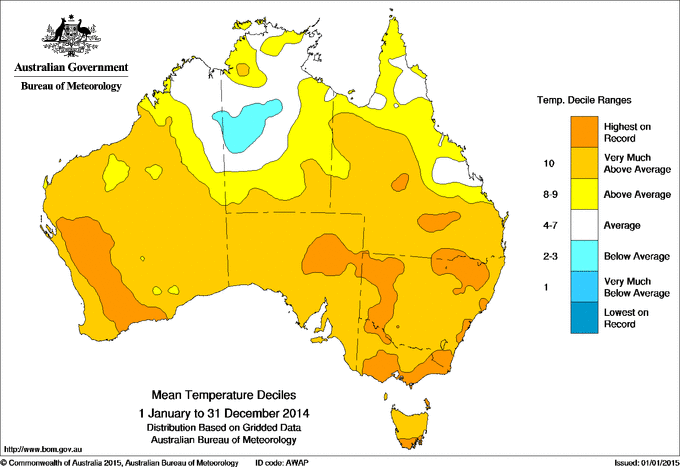
Data collected and analysed by the Bureau of Meteorology show that 2014 was Australia's third-warmest year on record while rainfall was near average nationally. Nationally, Australian temperatures have warmed approximately one degree since 1950, and the continued warmth in 2014 adds to this long-term warming trend. Simply the single most pressing and present public policy issue of our time. Yes,…


