Tag Archives Data Visualisation

The Guardian - Vaccination Simulations

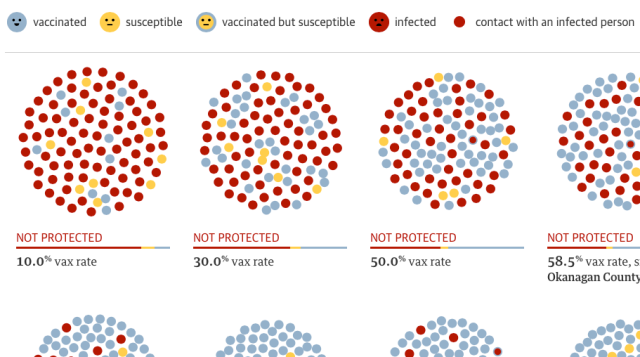
The vaccination "debate" continues/exists. I checked, it is February 2015. This is the 21st century [by most calendars] Another outstanding contribution to the public-health policy debate [sadly] by the Guardian US interactive team of Rich Harris, Nadja Popovich and Kenton Powell  Reason and the public good appear less a component of modern society than I was aware. In response to those that wish to open…

Songs of Humpbacks

Thanks to FlowingData for highlighting this link by Albert Cairo to the article by David Rothenberg and  Mike Deal " Whale Song Explained". The largest single pressing of any album of recorded music was not made by Michael Jackson or Mariah Carey, but by an animal the size of a city bus. Ten million copies of Songs of the Humpback Whale were inserted into…

World Atlas of Language Structures... Another in my mini-series of exceptional visual story-telling.. Another winner in the Information is Beautiful Awards for 2014 Links PuffPuff Project

There are more than 1,200 active satellites orbiting earth right now, taking pictures, relaying communications, broadcasting locations, spying on you, and even housing humans.   A database compiled by the Union of Concerned Scientists allowed David Yanofsky and Tim Fernholz to produce a stunning visualisation. Links Every Satellite - qr.com Union of Concerned Scientists Satellite Database

Mapdwell's web-based Solar System platform helps users design at-home solar energy systems: it visualizes the costs and benefits of installing a solar roof by layering information about tax credits and carbon emissions savings onto a topographical map of local roofs, and helps determine the most efficient spots for panels. Links Mapdwell

Yes, a repeat from WhaleSongServices, but I think it is worth it. I am proud to be a part of the launch of Data + Design @DataDesignBook. A free, open source e-book made by 50+ contributors from around the world!! For anyone and everyone that has ever struggled with making data accessible, struggled to use evidence to improve planning or simply grappled with the best way…

Close